
Pest Control Seasonality Report
See how revenue, margins, and cash move through the pest control year.
Get the Seasonality Report
You know your business is seasonal. You see it in the phones, the routes, and the schedule.
What you can’t see is what that cycle does to your financials. A year-end P&L can show a profitable business without showing the pressure it took to get there: techs hired before the calls come in, marketing spent before the revenue lands, and overhead that keeps running through the slow months.
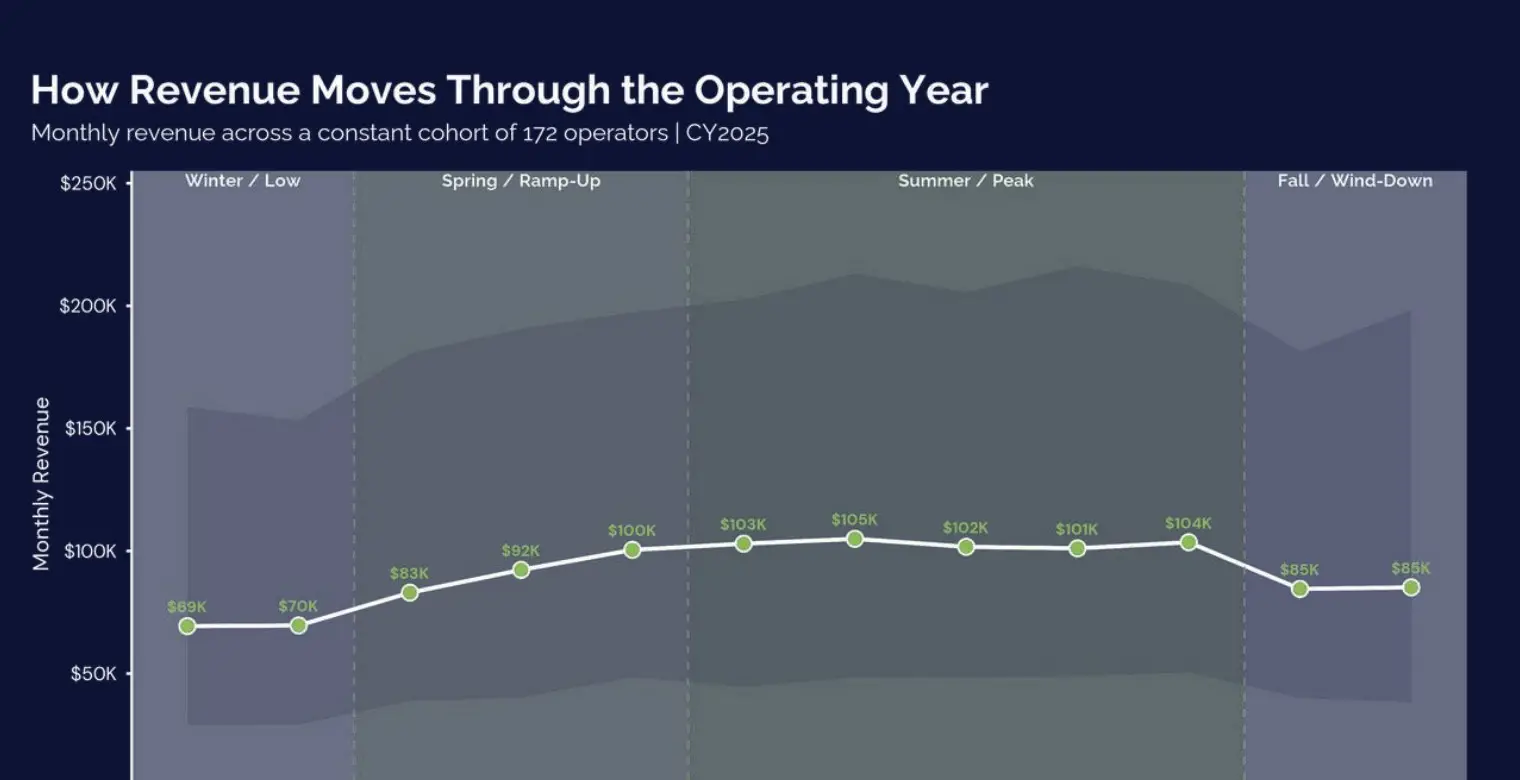
We pulled the real books from 191 pest control operators, January 2025 through May 2026, and followed revenue, cost structure, profitability, cash, and working capital through four operating seasons: Low (Jan–Feb), Ramp-Up (Mar–May), Peak (Jun–Oct), and Wind-Down (Nov–Dec). Segmented by revenue tier and region, so you are comparing against operators your size.
Most industry reports run on surveys, which means they run on what operators say. This one runs on what showed up in the books.
Busy season isn’t your best season.
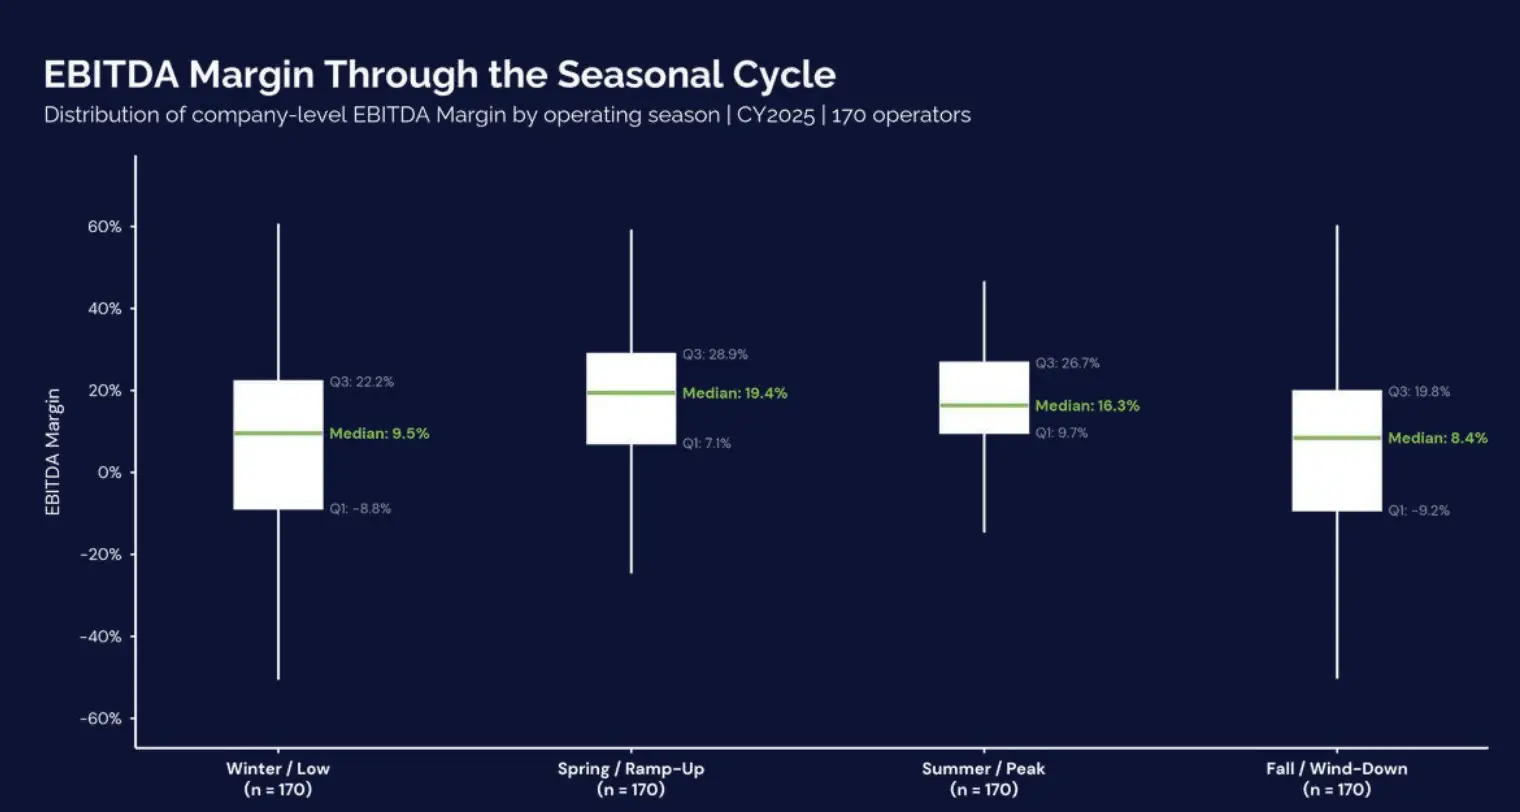
Median EBITDA margin peaks at 19.4% during Ramp-Up, then slips to 16.3% at Peak even as revenue keeps climbing. Cash and working capital don’t top out until Wind-Down. Each part of the business runs on its own clock, and most operators only plan around one of them.
Top operators hold a 30.8% EBITDA margin at Peak. Everyone else runs 13.2%.
| Median, CY2025 | LowJan–Feb | Ramp-UpMar–May | PeakJun–Oct | Wind-DownNov–Dec |
|---|---|---|---|---|
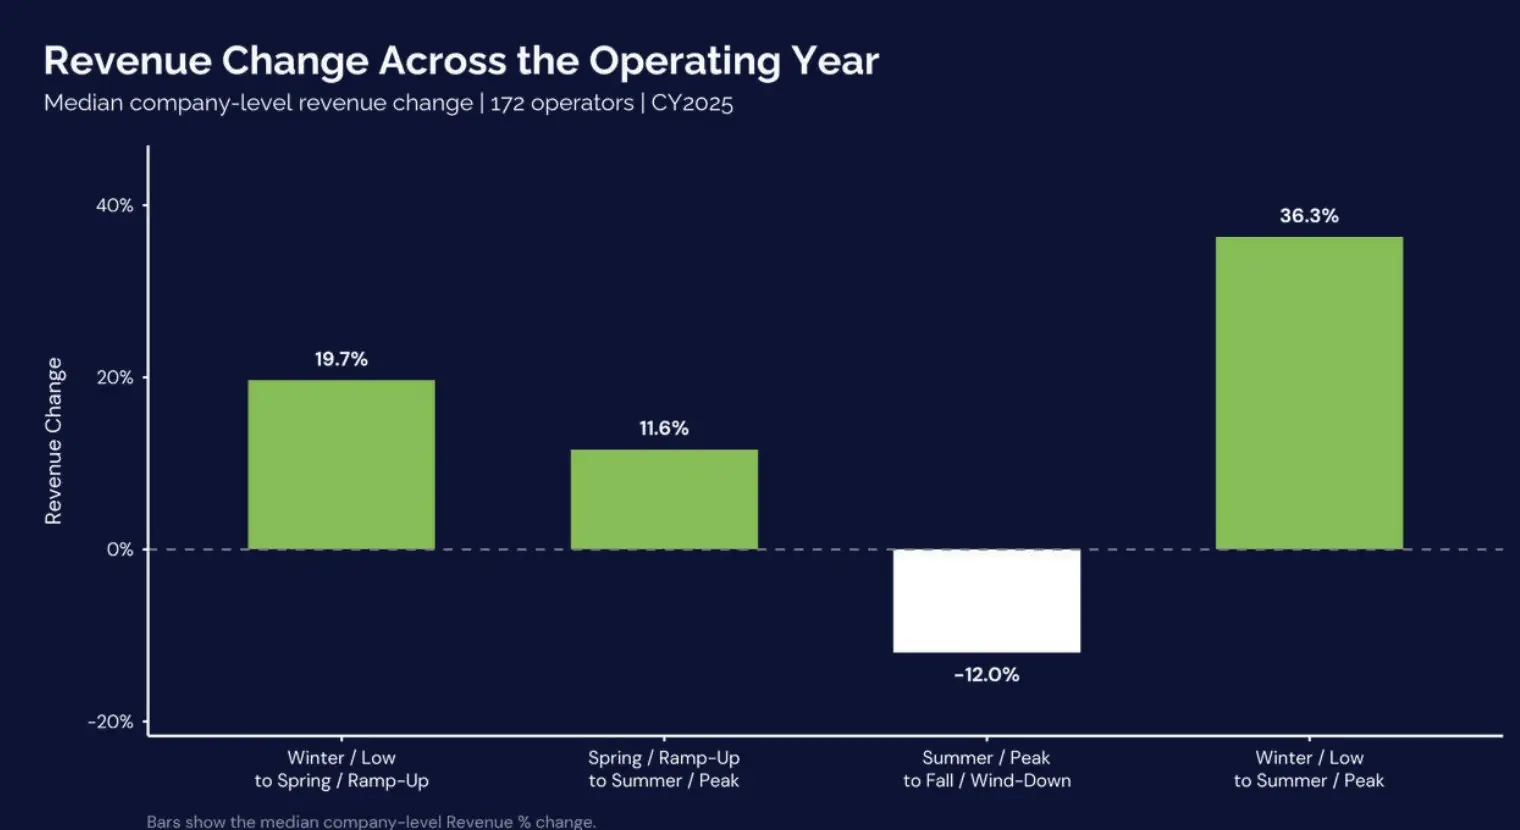
| Revenue vs. Low Season | Baseline | +19.7% | +36.3% | +19.3% |
| Gross margin | 59.0% | 61.7% | 61.2% | 58.6% |
| Expense % of revenue | 48.5% | 41.6% | 42.4% | 48.6% |
| EBITDA margin | 9.5% | 19.4% | 16.3% | 8.4% |
| Cash | $45K | $47K | $56K | $59K |
| Working capital | $43K | $45K | $58K | $74K |
Swipe the table to see every column.
Look at the EBITDA row again. Margin peaks in spring, not summer. By Peak, revenue is 36% above Low Season, but expenses have crept back up and the margin gives some of it back. Ramp-Up is where operating leverage gets built. Peak is where it gets protected, or doesn’t.
Why seasonality matters
Annual profitability tells you how the year turned out. Seasonality explains what it took financially to get there.
You run the business month by month. Payroll has to be funded, technicians hired and trained ahead of demand, and marketing dollars spent before the revenue they create gets collected. Without a seasonal reference point, you cannot tell:
- Whether your spring build is normal or running behind your peers
- Whether your margin slipping at Peak is typical or a cost problem
- When your cash should be tight and when it should be rebuilding
- How much cushion it takes to carry the business from Low Season into Peak
That is what this report gives you. Not more numbers. Timing for the ones you already have. If you want the full-year view first, start with the Pest Control Financial Performance Benchmark and what a healthy margin looks like in home service.
Charts from the seasonality report
What this report includes
Revenue Seasonality
How revenue builds from Low Season through Ramp-Up, Peak, and Wind-Down, and how big the swing is by company size. Operators under $1M see a 44% Low-to-Peak build. Operators between $1M and $3M see about 30%.
Cost Structure and Margins
Gross margin and expense % of revenue through each season, showing when cost absorption improves, when it slips, and how much margin the typical operator gives back at Peak.
EBITDA and Operating Leverage
EBITDA margin through the full cycle, peak versus low profitability by revenue tier and region, and how much operating leverage the typical operator builds during Ramp-Up.
Cash and Working Capital
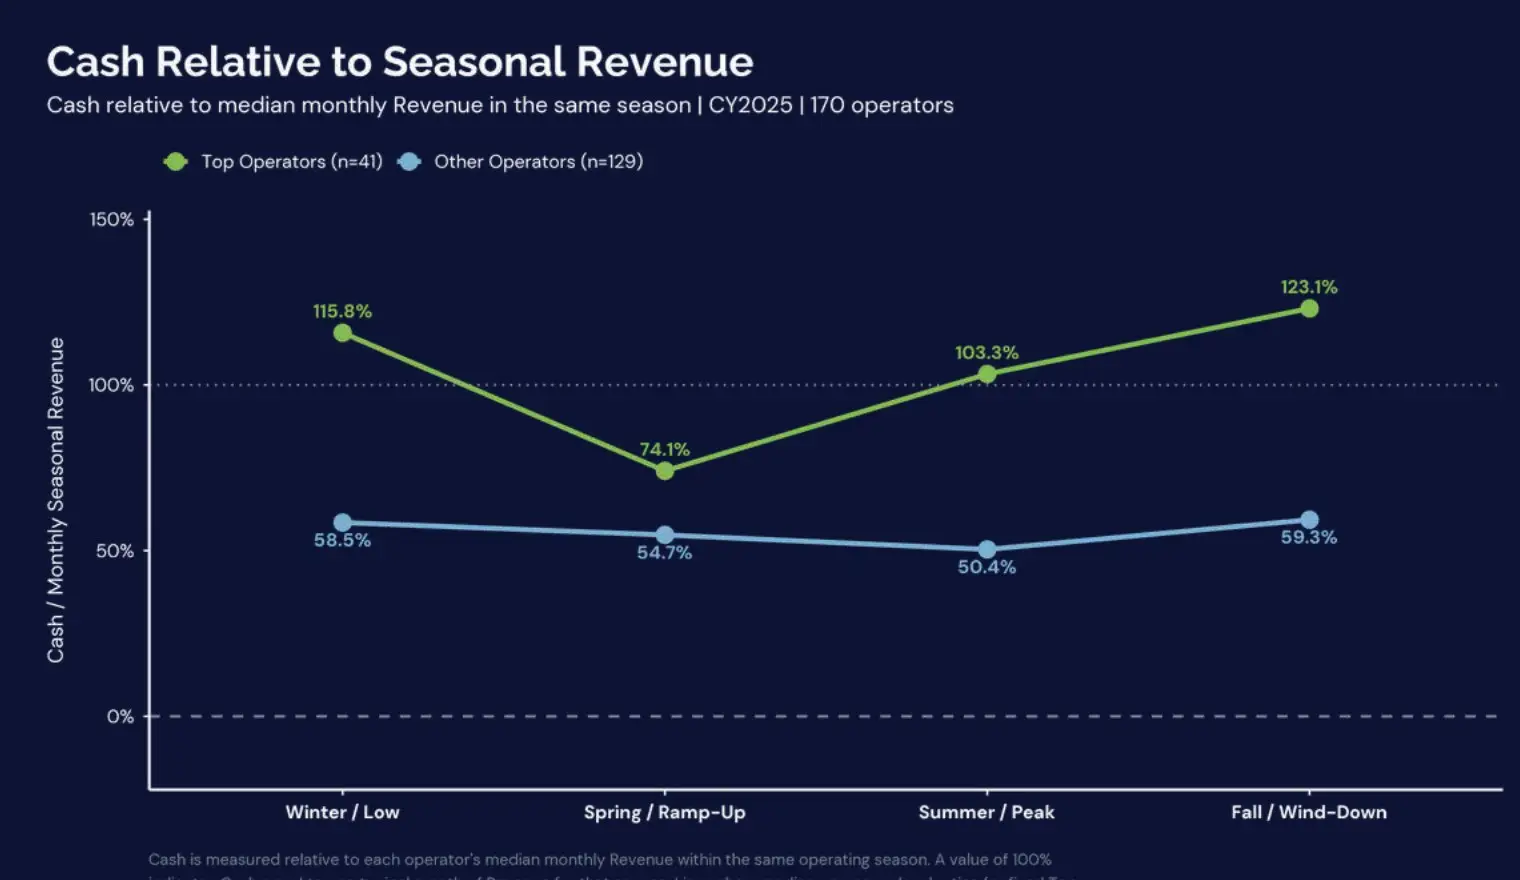
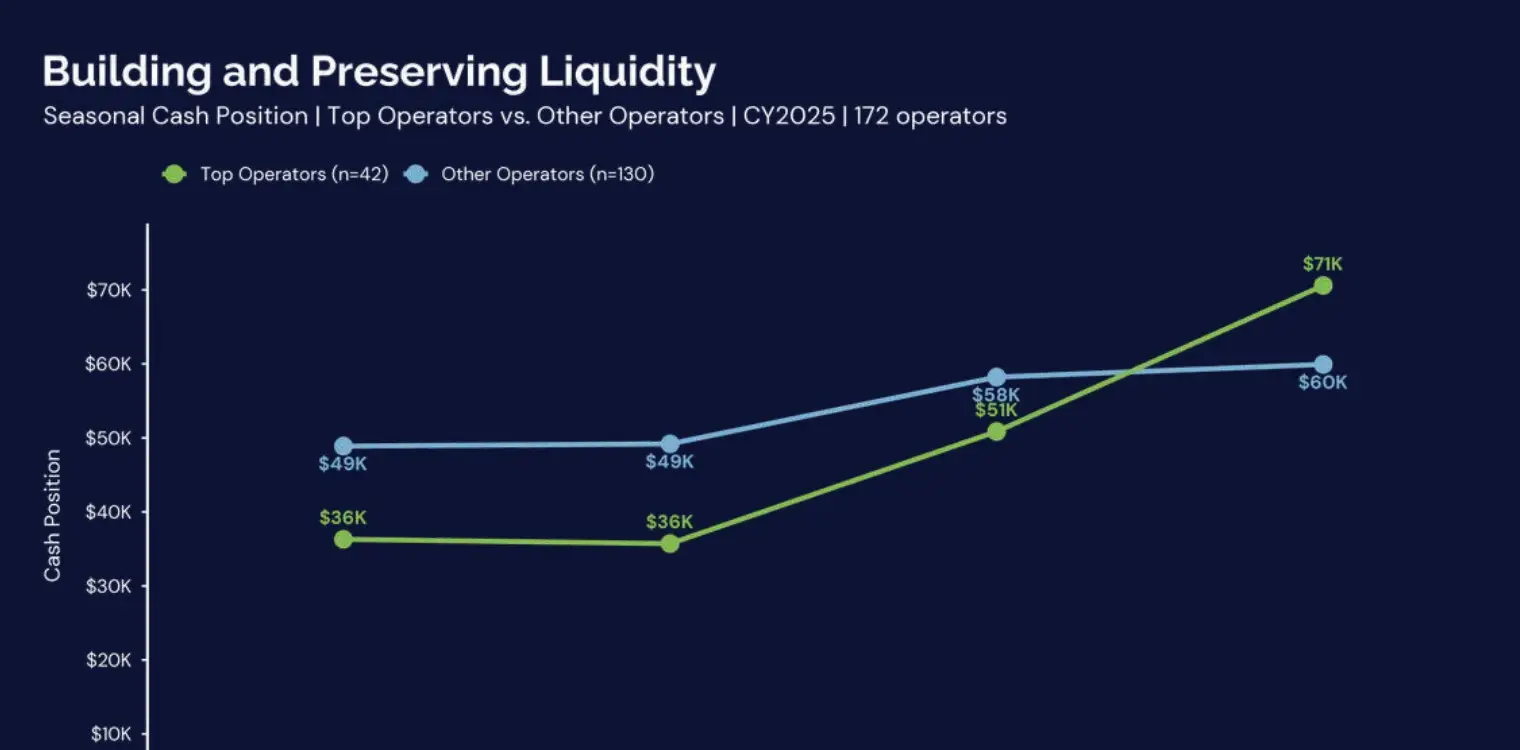
How cash and working capital move through the year, why Peak revenue is not Peak cash, and how many operators actually build liquidity from Low Season to Peak. About two-thirds do. One-third don’t.
Top Operator Playbook and Planning Toolkit
What separates the 42 top operators from everyone else at each stage of the cycle, plus a seasonal self-diagnostic and planning toolkit you can fill in with your own numbers.
Every number in here maps to a line you already have on your P&L or balance sheet. Nothing exotic, nothing you need an analyst to interpret.
Where the data comes from
- pest control operators, January 2025 through May 2026
- 191
- operators in the core cohorts, depending on the metric
- 170–179
This is built from real bookkeeping data across 191 pest control operators, January 2025 through May 2026, mapped to a consistent chart of accounts so the comparisons hold up. That gives one full four-season cycle in 2025 and a second look at Low Season and Ramp-Up in 2026.
Every operator counts equally. Each company’s seasonal figure is its median month in that season, so a $10M operator doesn’t drown out a $600K one, and the five-month Peak doesn’t outweigh the two-month Low Season. The core cohorts run 170 to 179 operators depending on the metric.
Everything is segmented by revenue tier (under $1M, $1M to $3M, and $3M+) and region, so you are compared against operators your size in your part of the country.
Your P&L tells you how the year ended. This tells you what happened along the way.
How to actually use it
Pull your own monthly financials, group them into the four seasons, and put them next to the self-diagnostic tables. Then ask one question on every line: when does my number move, and how does that compare?
Then use it to:
- Plan hiring and marketing spend before the revenue arrives, not after
- Catch margin slipping at Peak before it costs you the season
- Know when cash should be tight and how much cushion you need
- Use Wind-Down to lock in the year’s gains instead of giving them back
You are not trying to copy the benchmark. You are trying to find the timing gaps worth fixing.
What this will not do for you
This is financial structure and historical timing. It will not tell you about technician utilization, route density, or pricing strategy. It will not forecast your year, and it shows patterns, not causes.
If you are looking for operational tactics, this is not it. If you want to know whether your seasonal swings in margin and cash are normal for a shop your size, it is.